Did you know that as of September 2023, the United States federal workforce comprised a staggering 2.95 million employees? This figure represents an astonishing breadth of career paths and opportunities, reflecting an ever-evolving federal job market. In a historical context, the federal workforce has seen periods of significant expansion, for instance, more than tripling from January 1939 to January 1944, reaching 3.41 million employees during wartime. Today, federal government employment statistics reveal a complex picture of government hiring trends, federal workforce data, and employment in government agencies. This article dives deep into the federal hiring demographics, illuminating the various branches of government and their role in shaping the nation’s workforce.
Key Takeaways
- Discover which branch of government hires most federal employees and how this impacts the federal job market.
- Get an up-to-date understanding of federal government employment statistics, showcasing the size and diversity of the federal workforce.
- Learn about government hiring trends and the implications for federal job opportunities in various states.
- Analyze federal workforce data to grasp the full scope of government employment analysis and its comparison to other industries.
- Explore the significance of employment in government agencies and how federal hiring demographics shape the landscape of the U.S. workforce.
Overview of Federal Employment Data
The vast landscape of the federal workforce is often captured through the lens of robust data sources such as the Enterprise Human Resources Integration-Statistical Data Mart (EHRI-SDM), which offers a comprehensive view of over 2 million Federal civilian employees. This data encompasses not only the scope of human resources but also a variety of elements including agency of employment, occupation specifics, and an array of transactional operations like promotions and awards.
Accounting for roughly 96 percent of all Federal civilian non-Postal Executive Branch employees, the EHRI-SDM provides critical insights into federal workforce growth and the extensive demographic breakdown of federal employees, ensuring a clear visibility into the federal employment landscape. However, it’s notable that the EHRI-SDM does not cover several agencies, a reminder of the complex tapestry that composes the entirety of the federal employment picture.
Historical Perspective on Federal Workforce Growth
Historically, the federal employment data reflects significant shifts within the federal landscape. Events and policy changes like the New Deal catalyzed a tripling in the size of the federal workforce from January 1939 to January 1944, indicating how federal employment is reactive to national needs and historical contexts.
Demographic Breakdown and Distribution of Federal Employees
The composition of the federal workforce is a mosaic of demographics, where a convergence of educational backgrounds, varying years of service, and a spread across numerous geographical locations illustrate a heterogeneous employment environment. Recent inclusions of data from the Bureau of Consumer Financial Protection and Federal Bureau of Investigation emphasize a federal employment data spectrum that is ever-evolving and adapting to include a holistic demographic representation.
Comparative Size to U.S. Industry Workforces
When placed in juxtaposition with US industry workforces, the federal employment pool, while smaller in comparison to some of the larger sectors, outmatches industries such as utilities and mining. This comparison illustrates the substantial, albeit sometimes understated, footprint of federal employment within the broader national employment framework.
Diligent reporting by the Office of Personnel Management (OPM) enriches our understanding of the Federal civilian workforce. Annual reports shed light on critical metrics encompassing hiring trends, separations, salary patterns, and retirement statistics. These reports, part of the linchpin of federal employment data, provide the necessary context for an informed comparison to US industry workforces and set the stage for an ongoing evaluation of the federal government’s role as an employer.
Which Branch of Government Hires Most Federal Employees?
When you explore the landscape of the federal job market, it becomes clear that one branch exceeds others in hiring federal employees. Based on comprehensive data, the executive branch emerges as the primary employer within the intricate structure of government hiring.

Major federal agencies within the executive branch not only drive the employment spectrum but also define the career paths for a multitude of professionals across various fields. Insights into the federal workforce reveal a dynamic and vast expanse of opportunities that millions have pursued.
Executive Branch Dominates the Federal Job Market
Powering through the statistics, it’s clear that the executive branch of government is at the forefront of hiring, championing a bulk of the federal workforce. Provided by the U.S. Bureau of Labor Statistics, figures from 2013 illuminate this phenomenon: of the approximate 2 million federal civilian workers, an overwhelming majority navigate through the corridors of major federal agencies. This only reiterates the executive branch’s robust role in cultivating the federal job market.
Major Agencies with the Highest Number of Employees
Drilling down further, the Department of Veterans Affairs commands the scene with 16.2% of the total federal employment, making it the frontrunner in service provision and branch of government hiring federal employees. Alongside, regional hotspots like Virginia, Maryland, and the District of Columbia are the central hubs that harness about 22% of all federal government positions, shaping a unique employment culture around the nation’s capital.
In conclusion, as you chart your path through the varied avenues of federal careers, remember that the executive branch and its constituent agencies stand as the cornerstone of public sector employment, steadfast in both size and significance.
Analysis of Federal Workforce Trends
As you explore the ever-evolving landscape of the federal workforce, you’ll find insights into employment dynamics in government agencies and how they adapt to the nation’s developing demands. In an intricate tableau of roles and responsibilities, the federal hiring process mirrors the pulse of societal shifts, oftentimes resulting in temporary hire surges to tackle immediate needs.
Shifting Employment Dynamics in Government Agencies
The richness of diverse occupational fields within the federal workforce paints a picture of a complex and dynamic employment environment. With over 2 million federal civilian workers employed across 350 various occupations in May 2013, this diversity is crucial for meeting a wide spectrum of governmental functions. Yet, the nature of employment dynamics in government agencies is such that it remains in a constant state of flux, catering to the country’s evolving needs and initiatives.
Federal Hiring In Response to Societal Needs
Throughout history, moments of national significance have shaped the patterns of federal hiring, often culminating in the expansion of the workforce to address critical societal needs. For instance, recognizing the requirement for specialized skills during unique situations, federal hiring in response to societal needs has manifested in multiple sectors, from administrative roles accounting for nearly 40% of the workforce, to professional and technical categories making up significant portions—over 469,000 and 307,000 workers respectively, in 2013.
Temporary Hire Surges and their Impact
Another aspect contributing to the dynamic nature of federal employment is the occurrence of temporary hire surges. These not only reflect the government’s responsive measures but also leave a lasting impact on workforce statistics and structures. Such surges can range from Census Bureau recruitments to emergency response teams, rapidly changing the numerical and demographic landscape, as seen when nearly 9% of federal workers in 2013 had disabilities, or when the significant concentration of 22% of federal employment laid within Virginia, Maryland, and the District of Columbia.
Understanding these trends is not just about crunching numbers; it’s about comprehending the societal fabric and the responsive measures of federal entities like the Department of Veterans Affairs and the Department of the Army, which together constituted nearly 30% of the civilian federal employment back in 2013. Behind these statistics lie stories of prompt adaptation and strategic foresight, echoing the resilience and capacity of the federal workforce to serve and protect the nation’s interests.
The States with the Most Federal Workers
When you explore the landscape of the United States federal employment, you’ll notice that certain states stand out for their substantial numbers of federal workers. As the backbone of the nation’s administrative functions, the density of these employees in specific areas highlights the symbiotic relationship between federal agencies and local economies. Let’s delve into the states that lead the nation in federal employment and how this impacts their workforce percentages.
Top States for Federal Employment and their Workforce Percentages
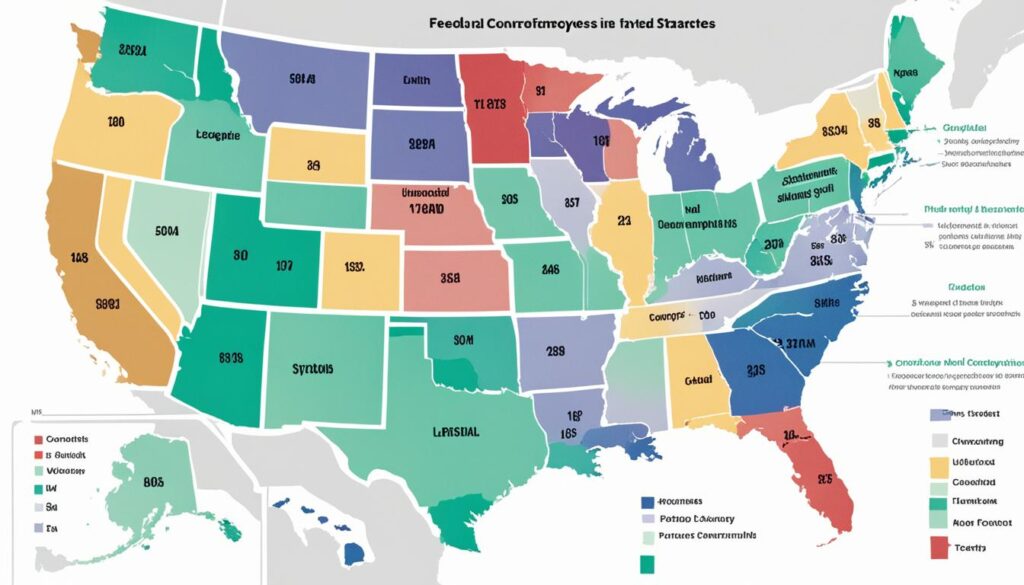
The sprawling state of California tops the chart with a whopping 248,067 federal employees, making it one of the states with the most federal workers. Not far behind is Texas, boasting 211,873 federal staff members, while Virginia hosts 206,269, marking it as another key player in federal employment by state. In 2022, these figures underscore the considerable portion of jobs provided by the federal sector in comparison to the private industries within these states. With a sizeable share of jobs rooted in federal employment, the workforce percentages by state reflect not only the concentration of federal activities but also the diversity of roles spanning various agencies and departments.

The Significance of Washington, D.C.'s Federal Employment
The federal employment by state discussion would not be complete without highlighting the significance of Washington D.C.’s federal employment. As the heart of the nation’s governance, the city is incomparable in its concentration of federal agencies and personnel. Nearly 22% of all federal employment was clustered in the District of Columbia and its adjacent states, Maryland and Virginia, back in 2013. This aggregation illustrates the central role that the national capital plays not only in policymaking but also as a major employer, firmly establishing Washington D.C. as a vital hub for the federal workforce.
Your understanding of these employment trends is crucial, as it not only reflects the fiscal and administrative weight of these states in the federal schema but also points to the broader economic health and opportunities available within these regions. As staffing trends continue to evolve, keeping an eye on the shifts in federal workforce percentages by state will provide deeper insights into the future landscape of federal employment and its interactions with local economies.
Breaking Down Federal Employment By Industry
Understanding the landscape of federal employment by industry can provide valuable insights into the scale and scope of government occupations in the United States. With data revealing a federal workforce of 2.95 million employees as of September 2023, examining this sector alongside others such as the information and education industries is not only intriguing but necessary for a comprehensive analysis.
Comparisons with Key Industries like Information and Education
Statistics show that the number of individuals engaged in federal employment is strikingly close to the over 3 million employees in the information industry. Even when positioned against the education sector, the federal workforce holds substantial weight, connecting millions of professionals directly and indirectly to governmental functions. These comparisons with the education industry highlight the significant role federal employees play, mirroring the impact of educators across the country.
How Does Government Employment Stack up to Large Private Sectors?
When examining government employment versus private sectors, the federal workforce proves formidable. Its size surpasses that of the utilities and mining industries, with more employees than even the entire agriculture, forestry, fishing, and hunting sector. This perspective underscores the federal government’s position as a major employer, rivaling even the vast employment figures of influential private entities.
- Defense-Military Programs, Department of Veterans Affairs, and Department of Homeland Security lead the count within federal offices, solidifying the government’s role as a principal employer.
- States like California, Texas, and Virginia emerge as notable hubs for federal employment, indicating a geographic dispersal that extends far beyond the borders of Washington, D.C.
- With long-term career appointments and opportunities for direct hires in critical need areas, federal employment also offers a variety of pathways for those seeking to serve within the public sector.
Your insight into this sector is now armed with a deeper understanding of how federal employment by industry not only compares with other industries but also stands as a pillar within the job market.
Demographics and Diversity in the Federal Workforce
As you delve into the composition of the federal workforce, it’s clear that understanding the demographics in federal workforce is essential for grasping the inclusivity and diversity within the government. Recent data portrays a workforce where just over 61% identifies as white, contrasting against the 18.2% who are Black, and a representation of Hispanic Americans at just 9.5%, despite them making up 18.9% of the total US population.
Demographic Breakdown of Federal Employees by Age, Gender, and Education
In terms of gender, there’s a notable disparity, with men comprising 55.6% of the federal government employees, and this figure rising to 62.2% at the senior level. Furthermore, the representation of veterans is striking; they constitute 30% of the federal workforce, a significant over-representation compared to their 5.6% share of the overall labor force. The data also reveals an empowering trend where 16.6% of federal employees identify as having a disability, which is higher than the 12% within the broader U.S. populace.
Diversity Representation in the Federal Workforce
Shifting focus to the higher echelons, just under 76% of senior federal executives are white, which underscores the need for ongoing efforts to enhance diversity in federal employment. The percentage of non-Hispanic white employees has slightly decreased from 63.3% in 2017 to 61.2% in 2021, suggesting a gradual shift towards a more diverse workforce. The demographic breakdown further underscores the importance of tailored recruitment and retention strategies to bolster the representation of all Americans in federal employment.
FAQ
Which branch of government hires most federal employees?
What is the current federal employment data?
How has the federal workforce grown historically?
What is the demographic breakdown of federal employees?
How does federal employment compare to different industries?
How does the executive branch dominate the federal job market?
What are the trends in federal workforce employment?
Which states have the most federal workers?
How does federal employment compare to large private sectors?
What is the demographic and diversity representation in the federal workforce?
Author
-

Sophia Alvarez brings extensive knowledge in employee management and strategic hiring practices. With over 15 years in HR, she has pioneered innovative approaches to talent acquisition and workforce planning.
View all posts


